Logging
Monitor your Edge Functions with logging to track execution, debug issues, and optimize performance.
Logs are provided for each function invocation, locally and in hosted environments.
Accessing logs
Production
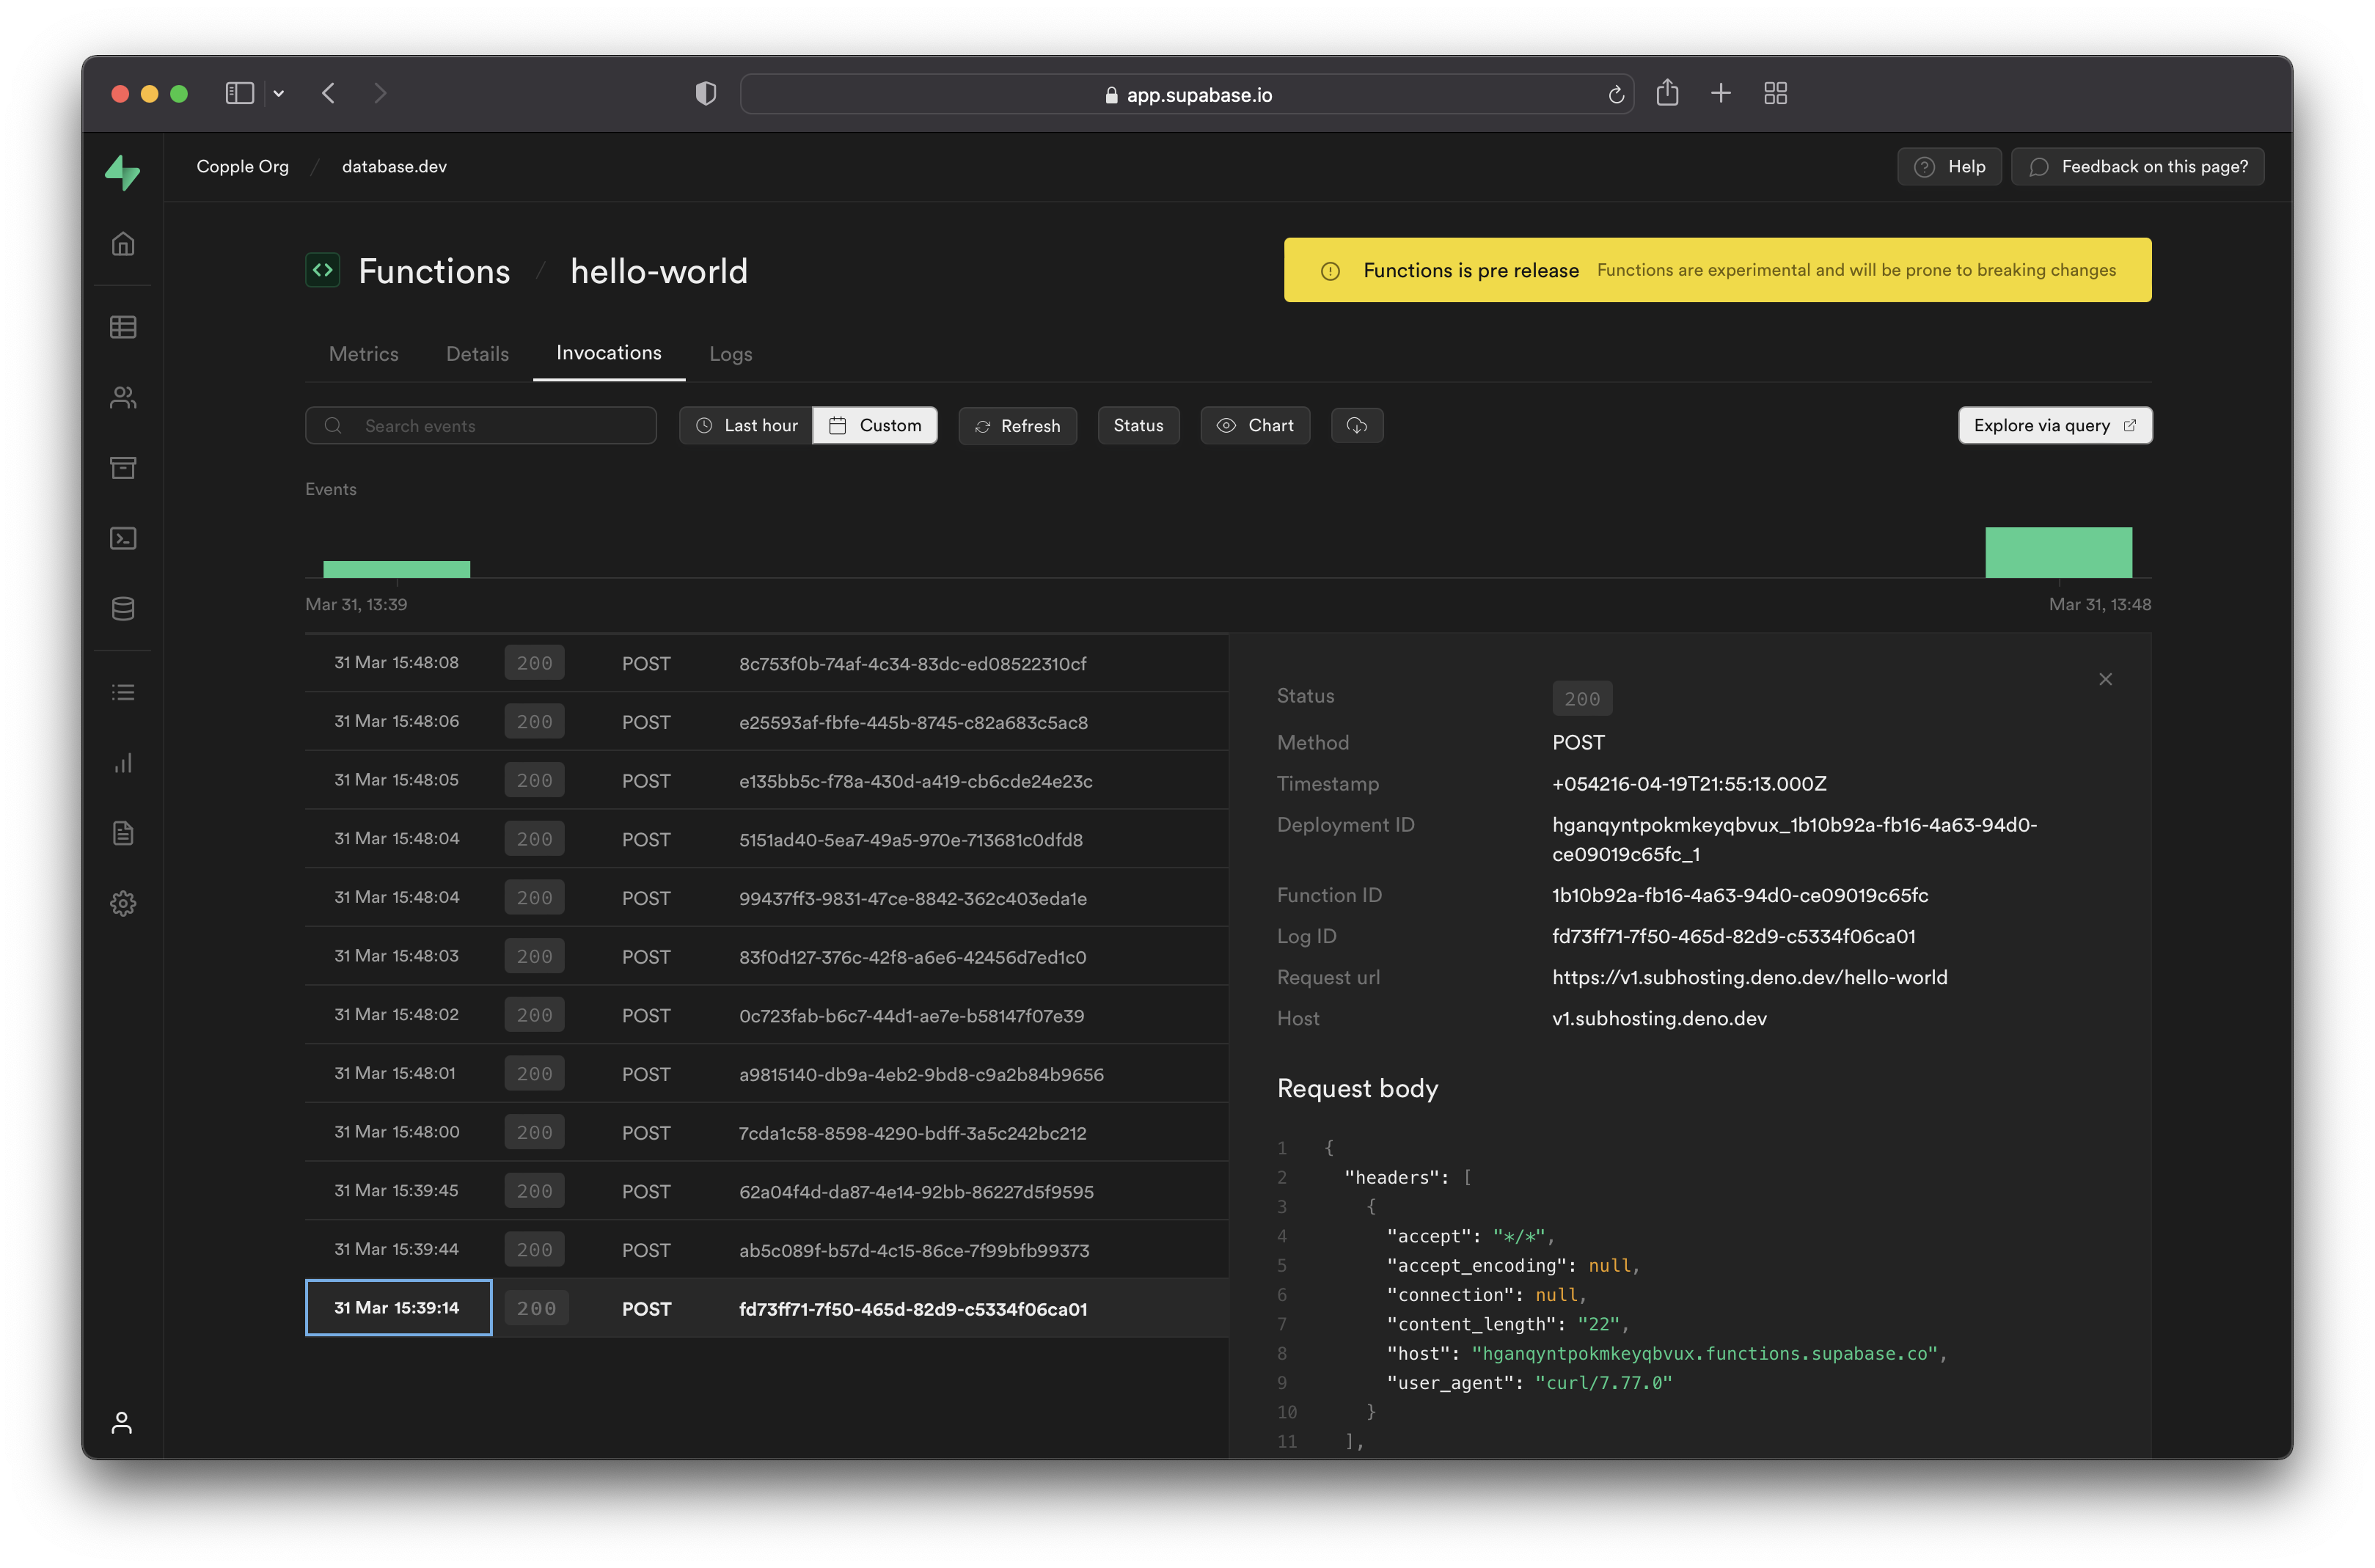
Access logs from the Functions section of your Dashboard:
- Navigate to the Functions section of the Dashboard
- Select your function from the list
- Choose your log view:
- Invocations: Request/Response data including headers, body, status codes, and execution duration. Filter by date, time, or status code.
- Logs: Platform events, uncaught exceptions, and custom log messages. Filter by timestamp, level, or message content.

Development
When developing locally you will see error messages and console log statements printed to your local terminal window.
Log event types
Automatic logs
Your functions automatically capture several types of events:
- Uncaught exceptions: Uncaught exceptions thrown by a function during execution are automatically logged. You can see the error message and stack trace in the Logs tool.
- Custom log events: You can use
console.log,console.error, andconsole.warnin your code to emit custom log events. These events also appear in the Logs tool. - Boot and Shutdown Logs: The Logs tool extends its coverage to include logs for the boot and shutdown of functions.
Custom logs
You can add your own log messages using standard console methods:
12345678910111213141516171819202122232425262728Deno.serve(async (req) => { try { const { name } = await req.json() if (!name) { // Log a warning message console.warn('Empty name parameter received') } // Log a message console.log(`Processing request for: ${name}`) const data = { message: `Hello ${name || 'Guest'}!`, } return new Response(JSON.stringify(data), { headers: { 'Content-Type': 'application/json' }, }) } catch (error) { // Log an error message console.error(`Request processing failed: ${error.message}`) return new Response(JSON.stringify({ error: 'Internal Server Error' }), { status: 500, headers: { 'Content-Type': 'application/json' }, }) }})A custom log message can contain up to 10,000 characters. A function can log up to 100 events within a 10 second period.
Logging tips
Logging request headers
When debugging Edge Functions, a common mistake is to try to log headers to the developer console via code like this:
12345// ❌ This doesn't work as expectedDeno.serve(async (req) => { console.log(`Headers: ${JSON.stringify(req.headers)}`) // Outputs: "{}"})The req.headers object appears empty because Headers objects don't store data in enumerable JavaScript properties, making them opaque to JSON.stringify().
Instead, you have to convert headers to a plain object first, for example using Object.fromEntries.
1234567// ✅ This works correctlyDeno.serve(async (req) => { const headersObject = Object.fromEntries(req.headers) const headersJson = JSON.stringify(headersObject, null, 2) console.log(`Request headers:\n${headersJson}`)})This results in something like:
12345678910111213141516171819Request headers: { "accept": "*/*", "accept-encoding": "gzip", "authorization": "Bearer eyJhbGciOiJIUzI1NiIsInR5cCI6IkpXVCJ9.eyJpc3MiOiJzdXBhYmFzZSIsInJlZiI6InN1cGFuYWNobyIsInJvbGUiOiJhbm9uIiwieW91IjoidmVyeSBzbmVha3ksIGh1aD8iLCJpYXQiOjE2NTQ1NDA5MTYsImV4cCI6MTk3MDExNjkxNn0.cwBbk2tq-fUcKF1S0jVKkOAG2FIQSID7Jjvff5Do99Y", "cdn-loop": "cloudflare; subreqs=1", "cf-ew-via": "15", "cf-ray": "8597a2fcc558a5d7-GRU", "cf-visitor": "{\"scheme\":\"https\"}", "cf-worker": "supabase.co", "content-length": "20", "content-type": "application/x-www-form-urlencoded", "host": "edge-runtime.supabase.com", "my-custom-header": "abcd", "user-agent": "curl/8.4.0", "x-deno-subhost": "eyJ0eXAiOiJKV1QiLCJhbGciOiJIUzI1NiIsImtpZCI6InN1cGFiYXNlIn0.eyJkZXBsb3ltZW50X2lkIjoic3VwYW5hY2hvX2M1ZGQxMWFiLTFjYmUtNDA3NS1iNDAxLTY3ZTRlZGYxMjVjNV8wMDciLCJycGNfcm9vdCI6Imh0dHBzOi8vc3VwYWJhc2Utb3JpZ2luLmRlbm8uZGV2L3YwLyIsImV4cCI6MTcwODYxMDA4MiwiaWF0IjoxNzA4NjA5MTgyfQ.-fPid2kEeEM42QHxWeMxxv2lJHZRSkPL-EhSH0r_iV4", "x-forwarded-host": "edge-runtime.supabase.com", "x-forwarded-port": "443", "x-forwarded-proto": "https"}